- Feb 08 | Just curious to understand about SMI and Conformance by Samir Parhi
- Jan 14 | Design of Extending SMP to CNCF Community Infrastructure Lab by Xin Huang
- Jul 14 | Sample Configuration file for running performance test by kumarabd
- Jul 01 | Service Mesh Performance makes its way to CNCF Sandbox Projects 🥳 by Sayantan Bose
- May 28 | About the Service Mesh Performance category by Lee Calcote
- Time consuming and Redundant
- Misinterpreted
-
Soak testing involves testing a service mesh with a typical production load, over a continuous availability period, to validate service mesh and workload behavior under production use. A good soak test would also include the ability to simulate peak loads as opposed to just average loads. A soak test would be something that we’d run over a weekend or over 24-hour period and we would be looking generally for things like memory leaks.
-
Stress testing is where we escalate the amount of load over time until we find the limits of the service mesh. Stress testing answers questions of which components will fail first when you push your mesh to extreme limits. Naturally, the results of stress tests identify which components need additional consideration in the face of such extreme load; where your service mesh deployment model and/or it’s configuration may break.
-
Load testing is where you understand the business requirements very well and can ramp up the load, leaving it running at a plateau until you’re satisfied that the performance is not continuing to degrade and then ramp down on the load. Load testing can help determine what normal performance metrics look like. By using iterative, load testing, you can determine whether new updates have been in par with code quality or not.
-
Capacity testing is when a test to determine how many users your application can handle before either performance or stability becomes unacceptable. Capacity testing addresses things like identifying the number of users your application can handle “successfully”. Having run capacity tests, you will have better visibility into events that might push your site beyond its limitations.
-
Spike testing is where we go over and above the maximum design capacity, just to see how the service mesh and workload can deal with a significantly spiking load. Spike testing helps identify the amount of load by which your service falls over.
- performance test configuration
- service mesh configuration
- environment configuration
- workload configuration
- performance test results
- Feb 08 | Just curious to understand about SMI and Conformance by Samir Parhi
- Jan 14 | Design of Extending SMP to CNCF Community Infrastructure Lab by Xin Huang
- Jul 14 | Sample Configuration file for running performance test by kumarabd
- Jul 01 | Service Mesh Performance makes its way to CNCF Sandbox Projects 🥳 by Sayantan Bose
- May 28 | About the Service Mesh Performance category by Lee Calcote
- Do I feel that this widget is worth its cost to me (the sales price)? The intrinsic weight that we assign to this feeling of value; to how valuable to consider a given item is based on many factors:
- As a detractant of the value: cost (dollars, interest on a loan, mental stress of a loan)
- As an additive of value: feature/function (usefulness to me and relative to how great my need is for such a widget), goodwill (to the brand), and psychology (peace of mind, social status, immediate satisfaction of purchase),
- Criticality
- How important is this function? How much would it cost me to get it elsewhere?
- Risk
- Positive: how much am I leaving exposed without this service mesh feature?
- Negative: how concerned am I that this service mesh feature will fail?
- Feb 08 | Just curious to understand about SMI and Conformance by Samir Parhi
- Jan 14 | Design of Extending SMP to CNCF Community Infrastructure Lab by Xin Huang
- Jul 14 | Sample Configuration file for running performance test by kumarabd
- Jul 01 | Service Mesh Performance makes its way to CNCF Sandbox Projects 🥳 by Sayantan Bose
- May 28 | About the Service Mesh Performance category by Lee Calcote
Blog
Learn more about Service Mesh Performance


Exploring Analyzing And Tuning Service Mesh Performance
Using Meshery and SMP Dashboard for Service Mesh Performance Analysis
Abstract
With the recent advancement of software development methodologies and frameworks, service meshes has been rapidly gaining the lime light. In this paper, we provide an introduction to service meshes and discuss their key use cases in modern cloud-native architectures. We also explore the challenges associated with performance analysis of service meshes and present a survey of recent research in this area. To address these challenges, we propose the use of soft computing techniques and tools like Meshery for performance analysis of service meshes. Our study includes a comparative analysis of different service mesh platforms and their performance under varying workloads. This paper provides insights into the benefits and limitations of service meshes and highlights the importance of performance analysis in ensuring the reliability and scalability of micro-services based applications.
Introduction
Service meshes is like a software defined network where the operators gets complete control over the different set of activities that is occurring within their application. Its a dedicated infrastructure layer that oversees service-to-service communication. It’s responsible for the reliable delivery of requests through the complex topology of services that comprise a modern, cloud native application. In practice, the service mesh is typically implemented as an array of lightweight network proxies that are deployed alongside application code, without the application needing to be aware.
Each part of an app, called a “service” relies on other services to give users what they want. If a user of an online e-commerce store wants to buy groceries, they need to know if the items they want, say “tomatoes” is in stock. So, the service that communicates with the e-commerce site’s inventory database needs to communicate with the product webpage, which itself needs to communicate with the users’s online shopping cart. To add business value, the owner of the site might eventually build a new service that gives users in-app product recommendation. Now this new service should also be cognizant of user’s shopping cart, and must be able to communicate with inventory database that the product page needed—it’s a lot of reusable, moving parts.
The above definition and use case example can further be mingled with the architecture depicted in Figure 1. In most cases, a service mesh in general is known to have two types of planes: Control Plane and Data Plane. Data plane is composed of intelligent proxies that are deployed as sidecars, basically an extra container deployed under the same Pod as the application container. These proxies regulate the flow of network communication between different microservices. Non-exhaustive list of activities managed by this data plane includes service discovery, health checking, routing, load balancing, authentication/authorization, and observability. While the control plane, sometimes referred to as brain of a service mesh, manages and configure corresponding components to enforce policies and collect telemetry. A survey of Cloud Native Computing Foundation (CNCF) community found that 68% of the organization are already using or planning to use service meshes in the next 12 months. In production, use of service meshes has been growing 40-50% annually. Service meshes are popular because they solve critical problems related to communication between loosely coupled services (also referred as microservices), which are widely adopted by enterprise companies due to their ease of management/development for production workloads.
Read the full article on TechRxiv
Discussions on "SMP"
Pipelining Service Mesh Specifications
Using SMI and SMP specs on your CI/CD pipelines with Meshery's GitHub Actions
With growing adoption of service meshes in cloud native environments, service mesh abstractions - service mesh-neutral specifications - have emerged. Service Mesh Performance and Service Mesh Interface are two open specifications that address the need for universal interfaces for interacting with and managing any type of service mesh. Let’s examine what each specification provides.
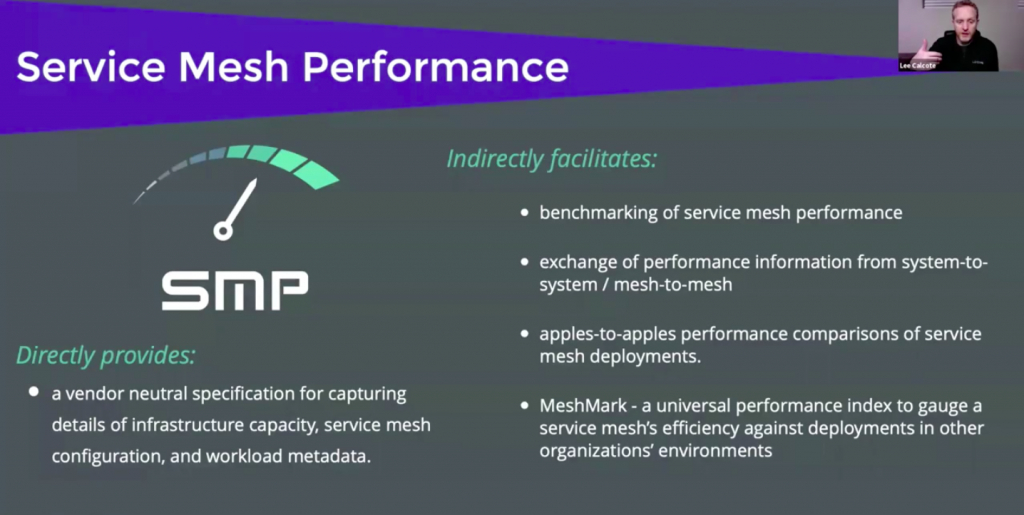
Service Mesh Performance standardizes service mesh value measurement, characterizing any deployment’s performance by capturing the details of infrastructure capacity, service mesh configuration and workload metadata.
Service Mesh Interface provides a standard interface for service meshes on Kubernetes. These (currently) four specfications offer a common denominator set of interfaces to support most common service mesh use cases and the flexibility to evolve to support new service mesh capabilities over time.
As a service mesh agnostic tool that provides lifecycle and performance management of a large number of (10+) service meshes, Kubernetes applications, service mesh patterns and WebAssembly filters, Meshery is the ideal tool for the job when it comes to implementing these specifications.
Meshery also comes with two new GitHub Actions that do exactly this. The Meshery SMI Conformance Action which validates SMI conformance in your pipeline and the Meshery SMP Action which runs SMP compatible performance benchmarks.
But how do we use these actions? What do they offer? Let’s find out!
Service Mesh Interface Conformance GitHub Action
Conformance of SMI specifications is defined as a series of test assertions. These test assertions are categorised by SMI specification (of which, there are currently four specifications) and comprise the complete suite of SMI conformance tests. Conformance requirements will change appropriately as each new version of the SMI spec is released. Refer to Meshery’s documentation for details of how Meshery performs SMI conformance.
Using Meshery’s SMI Conformance GitHub Action
The Service Mesh Interface Conformance GitHub Action is available in the GitHub Marketplace. You can configure this action to trigger with each of your releases, on every pull request. or any GitHub workflow trigger event.
An example of the action configuration which runs on every release is shown below. The action handles setting up a Kubernetes environment, deploying the service mesh (see supported service meshes), running the conformance tests and reporting back the results to the SMI Conformance dashboard in Meshery.
 name: SMI Conformance with Meshery
 on:
   push:
     tags:
       - 'v*'

 jobs:
   smi-conformance:
     name: SMI Conformance
     runs-on: ubuntu-latest
     steps:

       - name: SMI conformance tests
         uses: layer5io/mesheryctl-smi-conformance-action@master
         with:
           provider_token: $
           service_mesh: open_service_mesh
           mesh_deployed: false
You can also bring in their own cluster with specific capabilities and with a service mesh already installed.
name: SMI Conformance with Meshery
on:
  push:
    branches:
      - 'master'

jobs:
  smi-conformance:
    name: SMI Conformance tests on master
    runs-on: ubuntu-latest
    steps:

      - name: Deploy k8s-minikube
        uses: manusa/actions-setup-minikube@v2.4.1
        with:
          minikube version: 'v1.21.0'
          kubernetes version: 'v1.20.7'
          driver: docker

      - name: Install OSM
        run: |
           curl -LO https://github.com/openservicemesh/
           osm/releases/download/v0.9.1/osm-v0.9.1-linux-amd64.tar.gz
           tar -xzf osm-v0.9.1-linux-amd64.tar.gz
           mkdir -p ~/osm/bin
           mv ./linux-amd64/osm ~/osm/bin/osm-bin
           PATH="$PATH:$HOME/osm/bin/"
           osm-bin install --osm-namespace default

      - name: SMI conformance tests
        uses: layer5io/mesheryctl-smi-conformance-action@master
        with:
          provider_token: $
          service_mesh: open_service_mesh
          mesh_deployed: true
You can download a token from Meshery and add it as a GitHub secret (in the example above, the secret is MESHERY_PROVIDER_TOKEN). After the test is run, you can view the results from the Service Mesh Interface dashboard in Meshery UI.
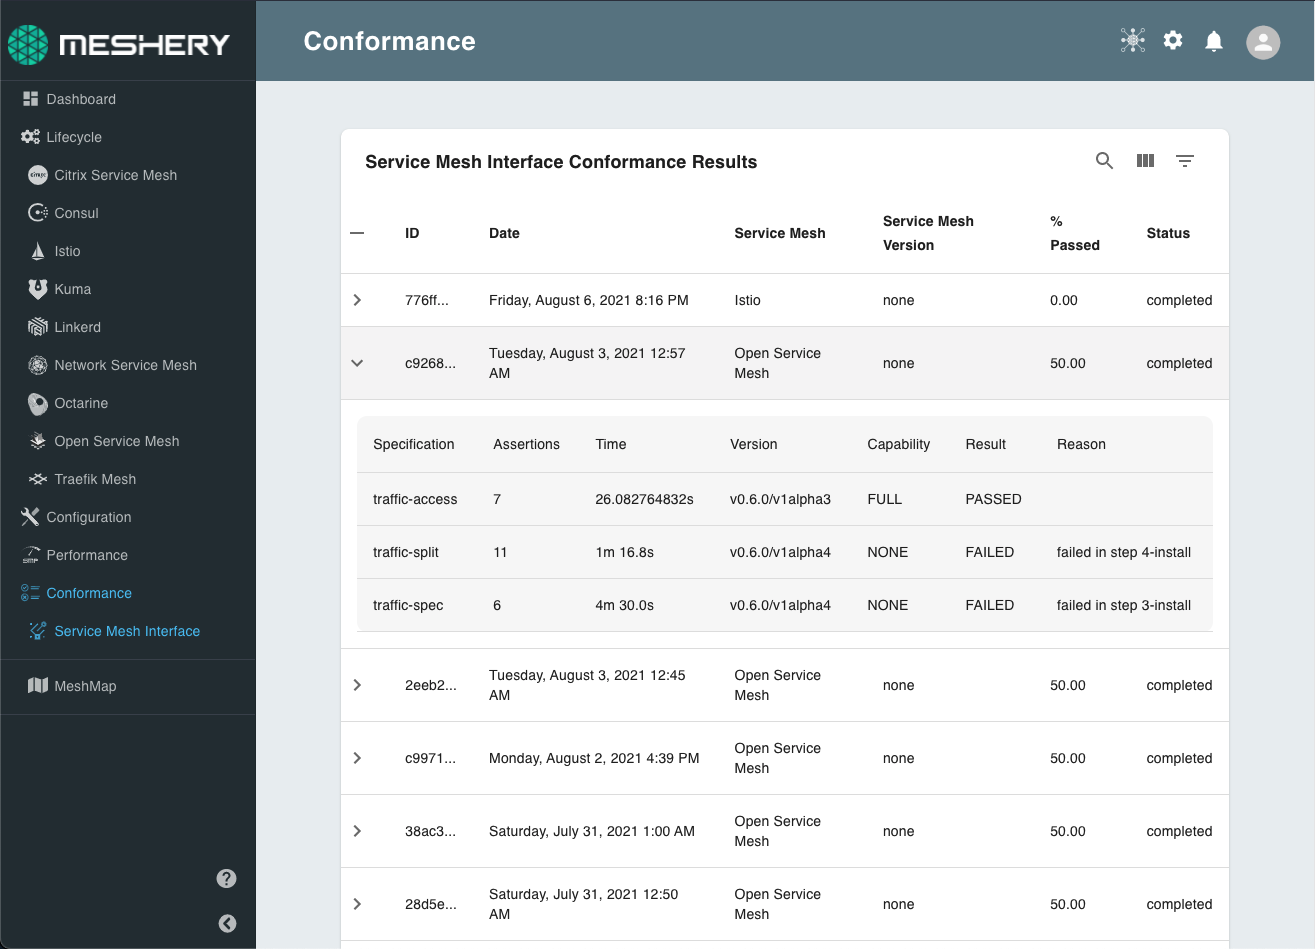
Participating service mesh projects can also automatically report their conformance test results to the SMI Conformance dashboard
Service Mesh Performance GitHub Action
Measuring and managing the performance of a service mesh is key to efficient operation of any service mesh. Meshery is the canonical implementation of the Service Mesh Performance specification. You can choose from multiple load generators and use a highly configurable set of load profiles with variable tunable facets to run a performance test. Meshery packages all these features into an easy-to-use GitHub Action.
Using Meshery’s Service Mesh Performance GitHub Action
The Service Mesh Performance GitHub Action is available in the GitHub Marketplace.You can create your own performance profiles to run repeatable tests with Meshery. You can configure this action to trigger with each of your releases, on every pull request. or any GitHub workflow trigger event. A sample configuration of the action is shown below.
name: Meshery SMP Action
on:
  push:
    branches:
      'master'

jobs:
  performance-test:
    name: Performance Test
    runs-on: ubuntu-latest
    steps:
      - name: checkout
        uses: actions/checkout@v2
        with:
          ref: 'perf'

      - name: Deploy k8s-minikube
        uses: manusa/actions-setup-minikube@v2.4.1
        with:
          minikube version: 'v1.21.0'
          kubernetes version: 'v1.20.7'
          driver: docker

      - name: Run Performance Test
        uses: layer5io/meshery-smp-action@master
        with:
          provider_token: $
          platform: docker
          profile_name: soak-test
You can also define your test configuration in an SMP compatible configuration file as shown below.
smp_version: v0.0.1
id:
name: Istio Performance Test
labels: {}
clients:
- internal: false
  load_generator: fortio
  protocol: 1
  connections: 2
  rps: 10
  headers: {}
  cookies: {}
  body: ""
  content_type: ""
  endpoint_urls:
  - http://localhost:2323/productpage
duration: "30m"
See this sample GitHub workflow (action.yml) for more configuration details.
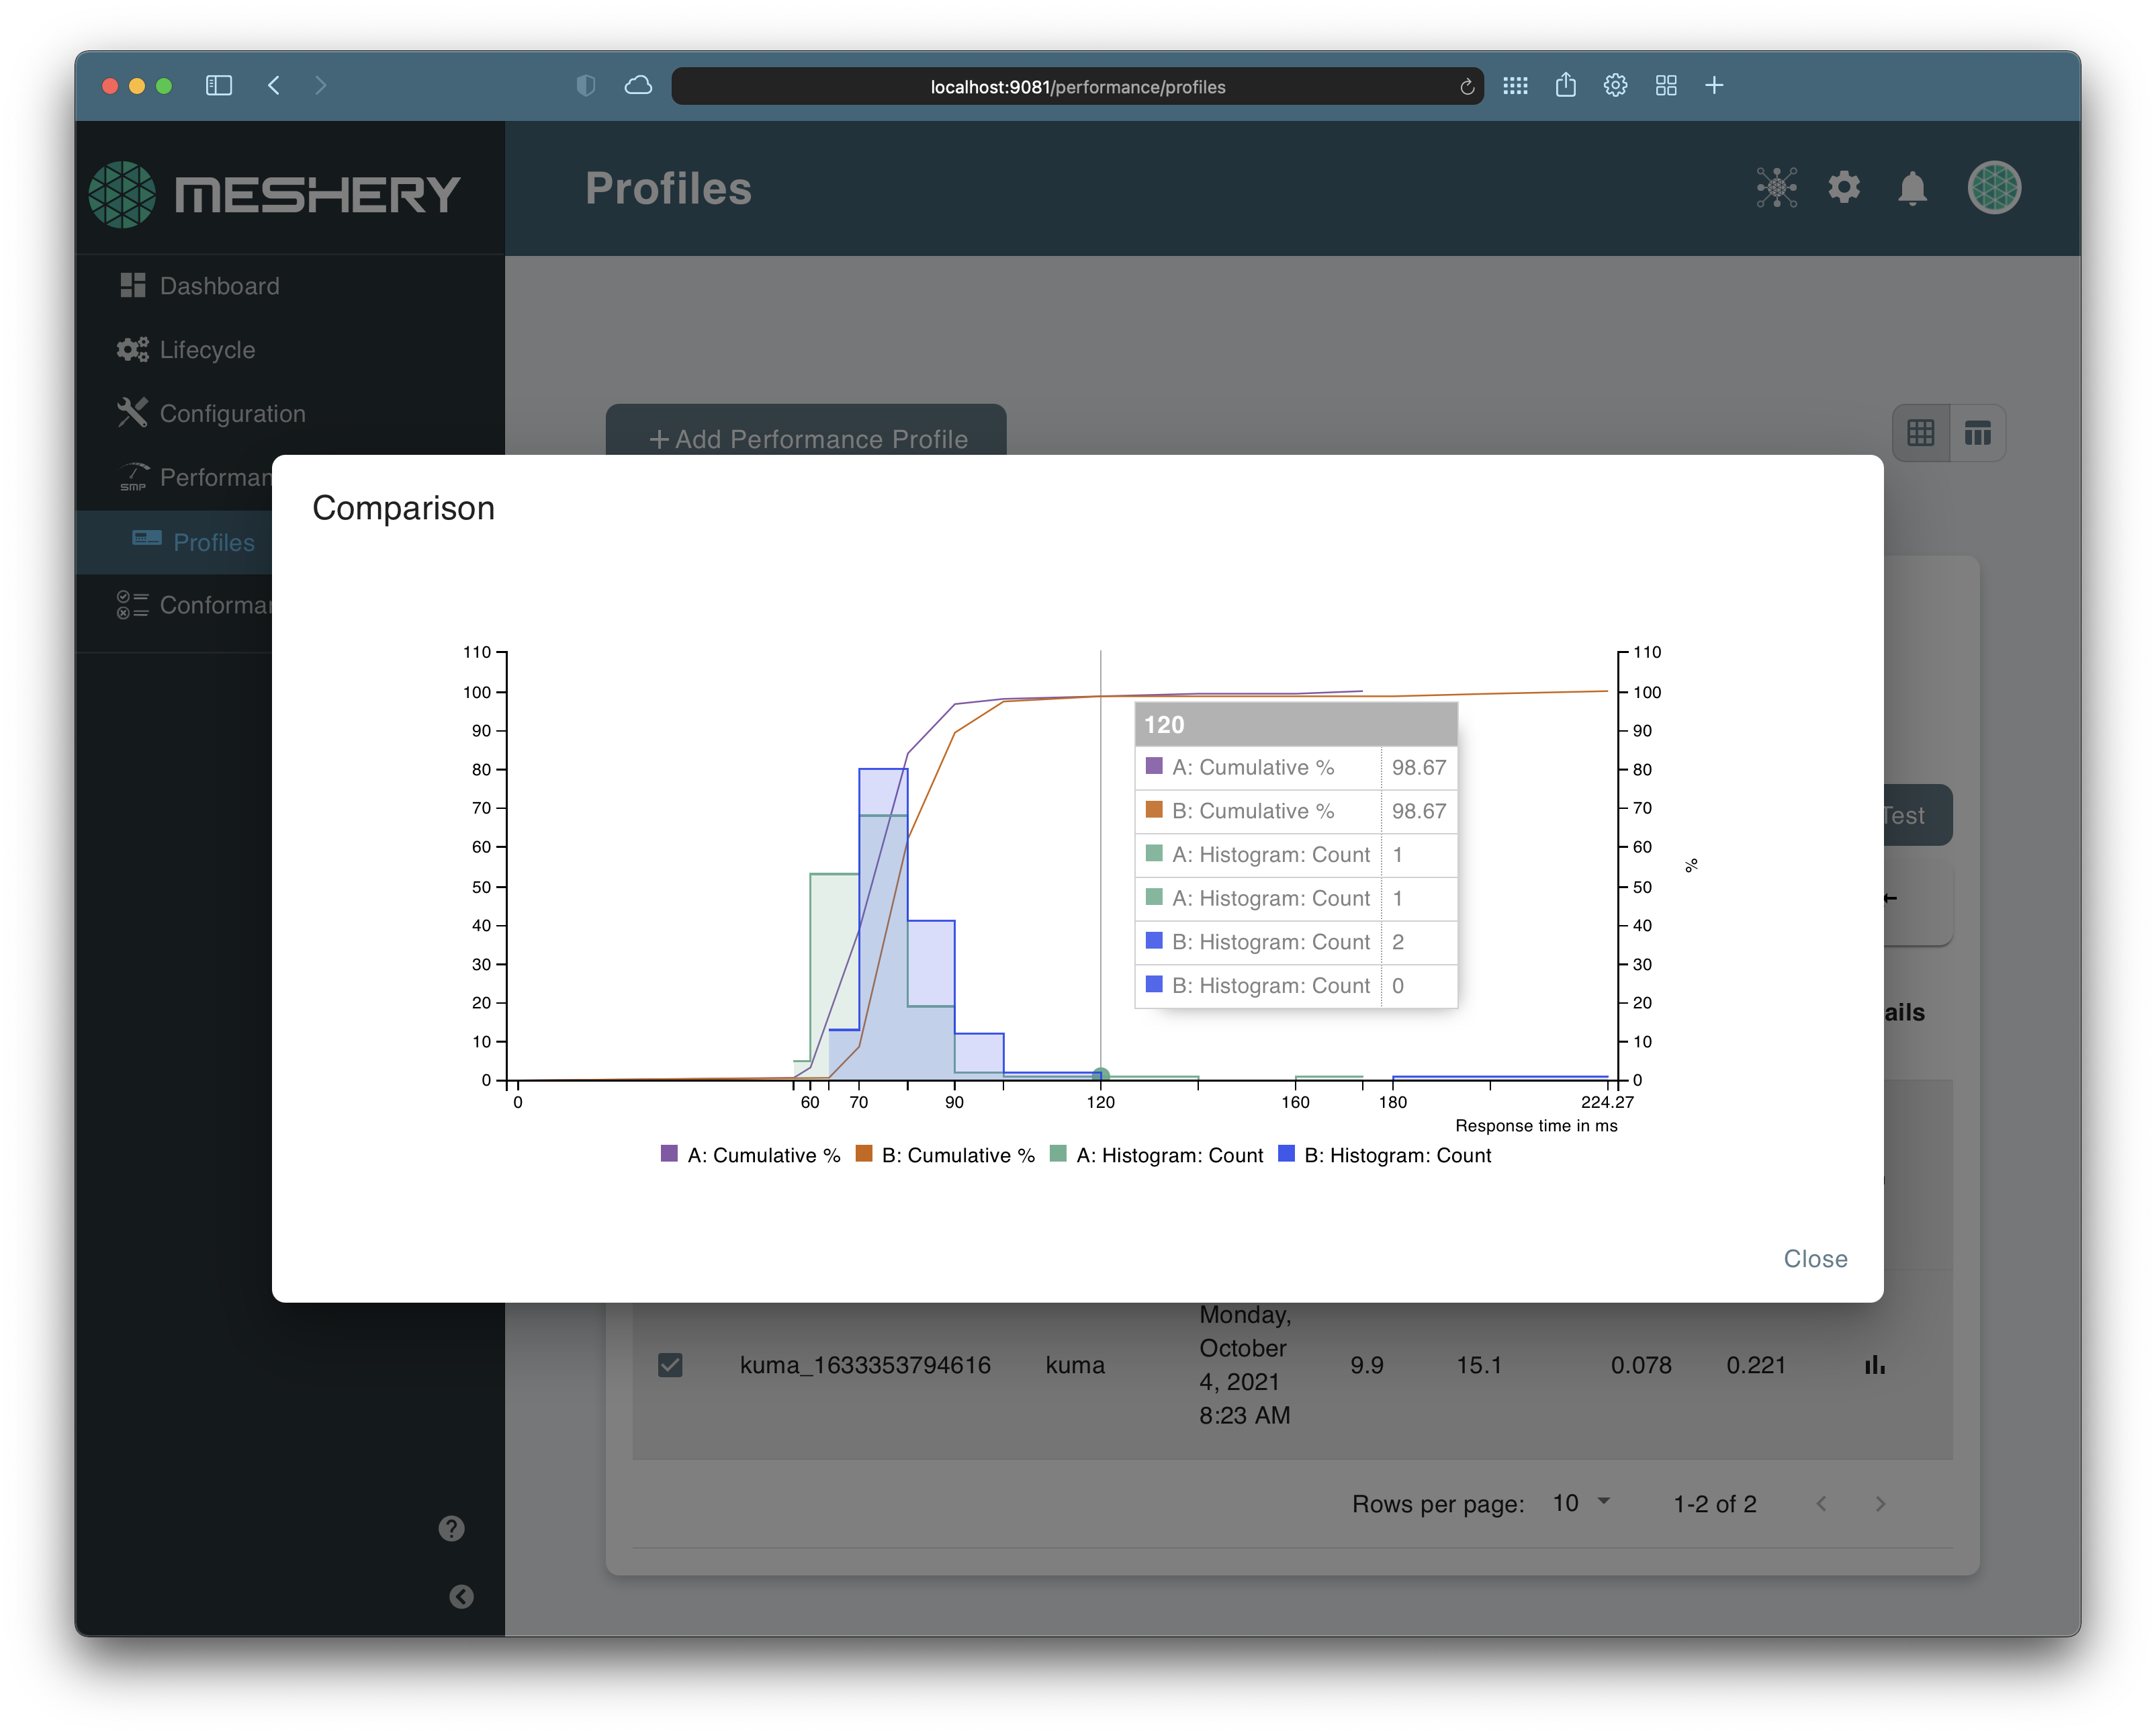
The results from the tests are updated on the Performance Management dashboard in Meshery. To learn more about interpreting the test results, check out this guide. You can always checkout the Meshery User Guides to dive deep into these features.
Stay meshy!
Discussions on "SMP"
Service Mesh Offers Promising Solution For Cloud Native Networking
Service Mesh can be thought of as a next generation of Software Defined Networking (SDN) for the cloud. Here are the main approaches.

“Cloud native” doesn’t just mean “running in the cloud.” It’s a specific deployment paradigm and uses containers and an orchestration system (usually Kubernetes) to help provision, schedule, run and control a production workload in the cloud, or even across multiple clouds. Within cloud native deployments, an increasingly common approach to networking is the service mesh concept. With a service mesh, instead of each individual container requiring a full networking stack, a grouping of containers all benefit from a mesh that provides connectivity and networking with other containers as well as the outside world.
Service mesh in the wild While the concept of a service mesh has applicability beyond just Kubernetes deployments, that’s arguably where the vast majority of deployments are today. Among the earliest cloud-native service mesh approaches is the open source Linkerd project, which is backed by Buoyant and began to really ramp up adoption in 2017.
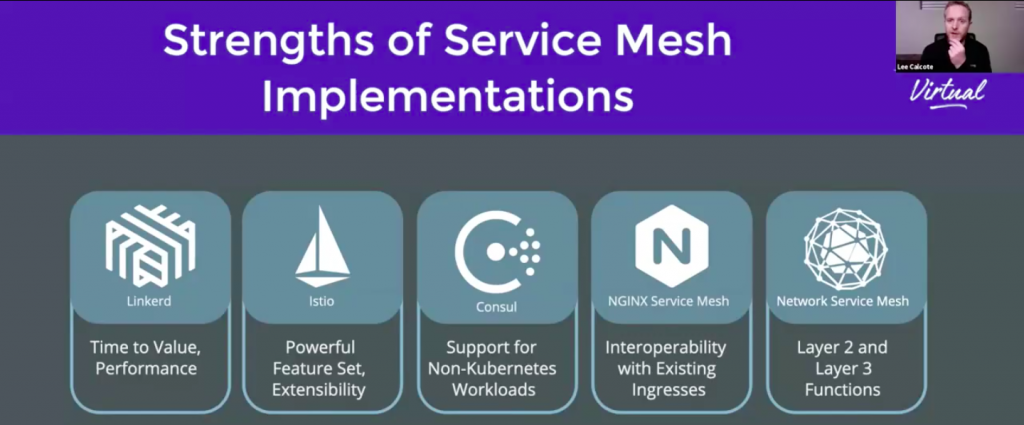
Over the past three years there has been an explosion of open source service mesh technology. Layer5, which develops service mesh aggregation technology, currently tracks over 20 different open and closed source mesh projects. Beyond Linkerd, among the most popular is the Google-backed Istio project, which recently hit its 1.8 milestone release. Cisco has backed the Network Service Mesh (NSM) effort, which works at a lower level in the networking stack than Linkerd, Istio and most others.
Each mesh has its own take on configuration and capabilities, which is a good thing for users. Simply put, there is no shortage of options and there is likely to be a service mesh that already exists to meet just about any need.
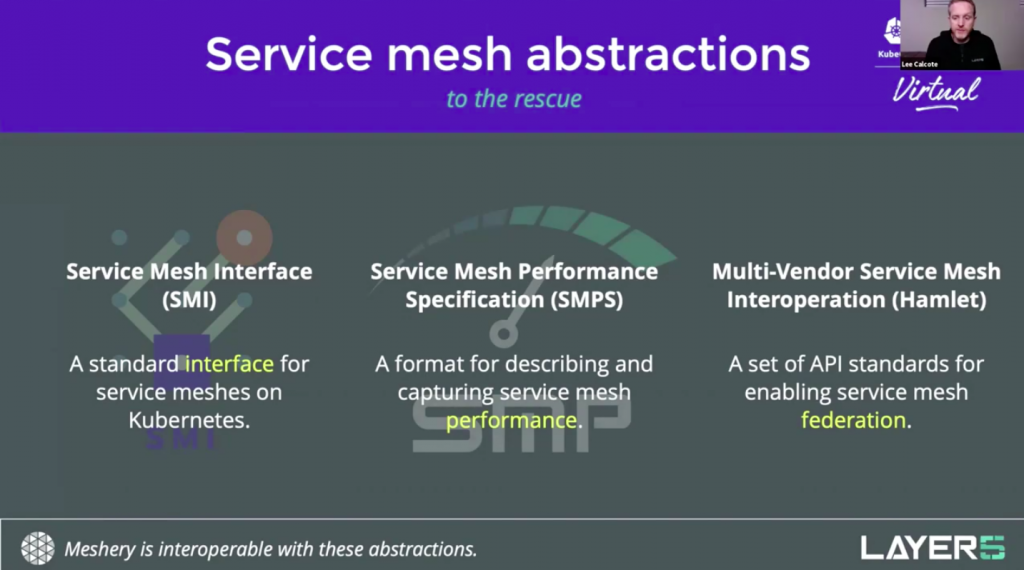
Service mesh abstraction While having lots of different service mesh technologies is good for choice, it’s not necessarily a good thing for simplicity or interoperability. That’s where the concept of service mesh abstraction comes into play.
At the recent KubeCon NA 2020 virtual event, Lee Calcote, co-chair of the Cloud Native Computing Foundation (CNCF) Networking Special Interest Group (SIG) and founder of Layer5, outlined how the different service mesh abstraction technologies fit together.
The Service Mesh Interface (SMI) is a way for any compliant service mesh to plug into Kubernetes. The Service Mesh Performance (SMP) abstraction is all about providing visibility into service mesh performance though a common interface. The third key abstraction is known as Hamlet and it provides multi-vendor service interoperation and mesh federation capabilities.
Service mesh benefits There are a number of different benefits that service meshes can bring, which are helping to accelerate adoption. Calcote explained that with a service mesh there is a decoupling of developer and operations teams such that each can iterate independently.
As such, operators can make changes to infrastructure independent of developers. DevOps is supposed to mean developer and operations teams work together, but the reality is often quite different and the ability to build application and infrastructure separately is why service mesh has been such a winning proposition for so many organizations.
“We live within a software defined network landscape, and service meshes in some respects are sort of a next-gen SDN,” Calcote said.
Read the full article on Enterprise Networking Planet
Discussions on "SMP"
Kubecon+cloudnativecon Service Mesh Battle Stories And Fixes
Service Mesh Battle Stories and Fixes
As more organizations implement service meshes, they are finding what works and what needs more work, and they are creating new management practices around this knowledge. A few tried-and-tested best practices were detailed last month during KubeCon+CloudNativeCon.
“There’s a lot to say about each of these service meshes and how they work: their architecture, why they’re made, what they’re focused on, what they do when they came about and why some of them aren’t here anymore and why we’re still seeing new ones,” Lee Calcote, founder of Layer5, explained during his talk with Kush Trivedi, a Layer5 maintainer, entitled “Service Mesh Specifications and Why They Matter in Your Deployment.”
Service mesh is increasingly seen as a requirement to manage microservices in Kubernetes environments, offering a central control plane to manage microservices access, testing, metrics and other functionalities. One-third of the respondents in The New Stack survey of our readers said their organizations already use service mesh. Among the numerous service mesh options available; Envoy, Istio, Linkerd and Kuma are but a few on offer.
Interoperability Is Key as Service Meshes Come and Go
Organizations will likely look to use at least more than one API service layer and service mesh for their clusters. This is why interoperability, and thus specifications, are critical for control planes as well. During his talk — “Service Mesh Specifications and Why They Matter in Your Deployment” mentioned above — for example, Calcote, asked rhetorically:
“How many specifications, how many standards are there that have come to the rescue, so to speak, for understanding and interoperating with the various service meshes that are out there?” Calcote said.
A service mesh can be used for testing router performance, service latency and other variables. However, determining service mesh performance in an apples-to-apples way can be challenging. When studying “published results from some of the service meshes [from providers] that do publish results about performance… what you’ll find is that they’re probably using an environment that isn’t necessarily like yours,” Calcote said. “They’re also using different statistics and metrics to measure [their service meshes] … and it doesn’t help.”
Service mesh performance (SMP) was created in an attempt to establish a way of comparing the performance of different services. “The SMP was born in combination with engaging with a few of those different service mesh maintainers and creating a standard way of articulating a performance of a mesh,” Calcote said.
Among the variables in consideration, in addition to the service mesh itself, include the number of clusters, workloads, the types of nodes, control plan configuration and the use of client libraries all affect performance.
“What costs more, what’s more efficient and what’s more powerful: These are all open questions that SMP assists in answering in your environment,” Calcote said.
Read the full, original post.
Discussions on "SMP"
Analyzing With Smp
Anytime performance questions are to be answered, they are subjective to the specific workload and infrastructure used for measurement. Given the variety of this measurement challenge, the Envoy project, for example, refuses to publish performance data because such tests can be
Such tests are complicated in part, because there are different types of performance testing, which include: soak testing, stress testing, load testing, capacity testing, and spike testing. Let’s examine each in context of service meshes and their workloads.
Outside of the different types of performance tests, performance management concerns include the need for performance and overhead data under a permutation of different workloads (applications) and different types and sizes of infrastructure resources. The need for cross-project, apple-to-apple comparisons are also desired in order to facilitate a comparison of behavioral differences between service meshes and which one might be best-suited for your workloads. Individual projects shy from publishing test results of other, competing service meshes. The need for an independent, unbiased, credible standard measurement is needed is why the Service Mesh Performance (SMP) was created.
Service Mesh Performance (SMP)
The Service Mesh Performance working group defines the Service Mesh Performance and is hosted within the CNCF SIG Network. Using SMP, MeshMark provides a universal performance index to gauge your mesh’s efficiency against deployments in other organizations’ environments. The group is also working in collaboration with the Envoy project to create easy-to-use tooling around distributed performance management (distributed load generation and analysis) in context of Istio, Consul, Tanzu Service Mesh, Network Service Mesh, App Mesh, Linkerd, and other service meshes.
The specification itself provides a standard format for describing and capturing:
The canonical implementation of this specification is the Meshery project. Figure 8-x provides insight to the fact that the specification defines a common collection of statistical analysis to be calculated for every performance test.
message PerformanceTestResult {
  message Latency {
    double min = 1;
    double average = 2;
    double p50 = 3;
    double p90 = 4;
    double p99 = 5;
    double max = 6;
} Measuring the value of your service mesh configuration
In this pattern we introduce the MeshMark scoring system as a derivation from the Service Mesh Performance. The focus of the MeshMark scoring system is to measure the value versus the overhead of a service mesh.
The value of SMP
Consider that the more value you try to derive from service mesh, the more you will ask it to do. Which is to say, that as someone reflects more deeply on the architecture of a service mesh - with its distributed proxies - and the more work it does, they will eventually wonder, “What overhead is running my service mesh incurring?”. This is one of the most common questions engineers have.
What SMP solves
Measurement data may not provide a clear and simple picture of how well those applications are performing from a business point of view, a characteristic desired in metrics that are used as key performance indicators. Reporting several different kinds of data can cause confusion. MeshMark distills a variety of overhead signals and key performance indicators into a simple scale. Reducing measurement data to a single well understood metric is a convenient way to track and report on quality of experience. Its purpose is to convert measurements into insights about the value of functions a service mesh is providing. It does so by specifying a uniform way to analyze and report on the degree to which measured performance provides user value.
Discussions on "SMP"
Meshmark Explained
MeshMark explained

An introduction to MeshMark might be best explained through a simple story that we can all relate to. As a consumer, when you make a purchase, there are generically two methods by which we determine our happiness about making any given purchase.
We ask ourselves:
It’s in this context that we compare how this widget functionally compares to other widgets and how much it costs compared to other widgets (using the factors described in #1). When you consider this and relate it to infrastructure (when you relate it to service meshes), ask yourself, “do I feel that this network function is worth its cost to me?”. Then, the computation that you do in our heads today is again based on a set of factors:
MeshMark functions as a service mesh performance index (a scale) to provide people the ability to weigh the value of their service mesh versus the overhead of their service mesh and assess whether they are getting out of the mesh what they are “paying” for in it.
The scoring system ranges from 0 to 100.
 Another aspect here is the need for distributed, multi-mesh and workload performance management. Distributed load testing offers insight into system behaviors that arguably more accurately represent real world behaviors of services under load as that load comes from any number of sources. This aim of enhancing the current load generation and analysis techniques to include distributed load testing is hoped to be achieved by the Distributed Performance Management of Service Meshes project, by analyzing and working hand ii n hand with Nighthawk, a versatile HTTP load testing tool.